Why Midwest Industrial Real Estate, and Why Now
July 14, 2026 · By Cody Leivas
Why Midwest Industrial Real Estate, and Why Now
Most of the capital chasing industrial flies over the Midwest on its way to Dallas, Phoenix, or the Inland Empire. To us, that’s the opportunity, not the warning. We own and operate industrial across the region, and the case right now comes down to four things you can measure: steady demand from reshoring and logistics, supply you can’t easily add in the small-bay segment we focus on, cap rates that price wider than the coastal gateways, and an entry basis often below what it costs to build new. None of it needs a heroic exit to work.
The demand is real and it is sticky
Indianapolis logged roughly 11.5 million square feet of net absorption over the trailing twelve months; Columbus near 10.9 million; Kansas City about 7.6 million (CoStar, Q1 2026). What you’re seeing is manufacturing and distribution moving back toward the interior. And these aren’t projected numbers — they’re square feet tenants actually moved into.
Two things drive that demand. First, reshoring and nearshoring of manufacturing, which lands mostly in the lower-cost, well-connected interior rather than on the coasts. Here’s the reason: the interior is cheaper to operate in and sits on the freight routes. Second, geography. The Midwest sits on the interstate and intermodal spine of the country. Chicago alone anchors roughly 1.38 billion square feet of industrial inventory (CoStar, Q1 2026). All the freight moving through has to be stored, staged, and distributed somewhere. A tenant who builds out a working facility near these corridors doesn’t move casually. That keeps them in place, which helps retention and gives you the upper hand at rollover.
The numbers hold up
Demand is only half of it. The supply side is what makes the basis defensible. Across our core markets, functional space stays tight while cap rates price wide:
| Market | Market cap rate | Vacancy | Asking rent/SF |
|---|---|---|---|
| Detroit | 10.8% | 4.9% | $8.96 |
| Cleveland | 10.4% | 4.3% | $6.71 |
| Milwaukee | 9.8% | 5.1% | $7.68 |
| St. Louis | 8.8% | 5.4% | $7.42 |
| Cincinnati | 8.5% | 4.8% | $7.53 |
Source: CoStar, Q1 2026. Milwaukee’s base spans roughly 270 million square feet, and the smaller-bay segment we target usually runs tighter than these metro-wide numbers.
Even the markets building more space are absorbing it. Columbus posted about 5.7% year-over-year rent growth alongside its double-digit-million absorption (CoStar, Q1 2026). Chicago held vacancy near 5.4% with rents near $10.07/SF and roughly 4.6% rent growth (CoStar, Q1 2026). Here’s why tight vacancy matters: when the existing space is full, rents start pulling toward what it costs to build new.
The pricing inefficiency below $10M
Here’s the part the big capital misses. The Midwest prices wider than the coastal gateways, and the gap gets bigger in the smaller deals.
Market cap rates across our footprint sit well above gateway pricing: roughly 8.2% in Chicago, 8.5% in Cincinnati, 8.8% in St. Louis, 9.8% in Milwaukee, and as wide as 10.4% in Cleveland and 10.8% in Detroit (CoStar, Q1 2026). Those are market-wide averages. The single-tenant and small-bay deals below roughly $10 million (too small for the big funds, too hands-on for passive coastal buyers) tend to clear even wider. Here’s the reason: the buyer pool thins out exactly where we hunt.
| Market | Market cap rate | Vacancy | Asking rent / SF |
|---|---|---|---|
| Chicago | 8.2% | 5.4% | $10.07 |
| Cincinnati | 8.5% | 4.8% | $7.53 |
| St. Louis | 8.8% | 5.4% | $7.42 |
| Milwaukee | 9.8% | 5.1% | $7.68 |
| Cleveland | 10.4% | 4.3% | $6.71 |
| Detroit | 10.8% | 4.9% | $8.96 |
Source: CoStar, Q1 2026. Read it top to bottom: cap rates widen while vacancy stays in the 4–5% range across every market. Wider pricing here is not a demand problem — it is a thinner buyer pool.
That spread isn’t free money, and you’d have to prove it out deal by deal. It pays you for slower rent growth in some markets, smaller buyer pools, and real management work. But it’s a real gap in a slice of the market the big allocators can’t reach efficiently. Buying steady cash flow at an 8–10% going-in yield, below what it costs to replace the building, is a different risk profile than underwriting a 5% coastal cap rate and hoping rents bail you out.
Market cap rates across our footprint run 8.2% to 10.8% (CoStar, Q1 2026) — wide enough to buy steady cash flow below replacement cost, without leaning on rent spikes or cap-rate compression to make the deal work.
Why the basis matters more than the forecast
We lead with basis. We buy at a price per square foot below replacement cost, so even if rents go flat and nothing exciting happens, the entry point still makes sense. Across most of our markets, in-place rents also sit below today’s asking rents. That’s a mark-to-market lever we capture as leases roll — not a bet on rent spikes, and not a bet on cap-rate compression.
This is where the Midwest’s smaller, older, functional small-bay stock works for us. You can’t easily build a new 40,000-square-foot multi-tenant building near an established corridor and pencil it at today’s rents — the construction math doesn’t support it. Here’s what that does: it keeps a lid on new competing supply in the exact segment we own, while the existing space stays leased. The edge is operational (leasing, keeping tenants, and managing rollover well), not financial engineering.
How Bluebird approaches it
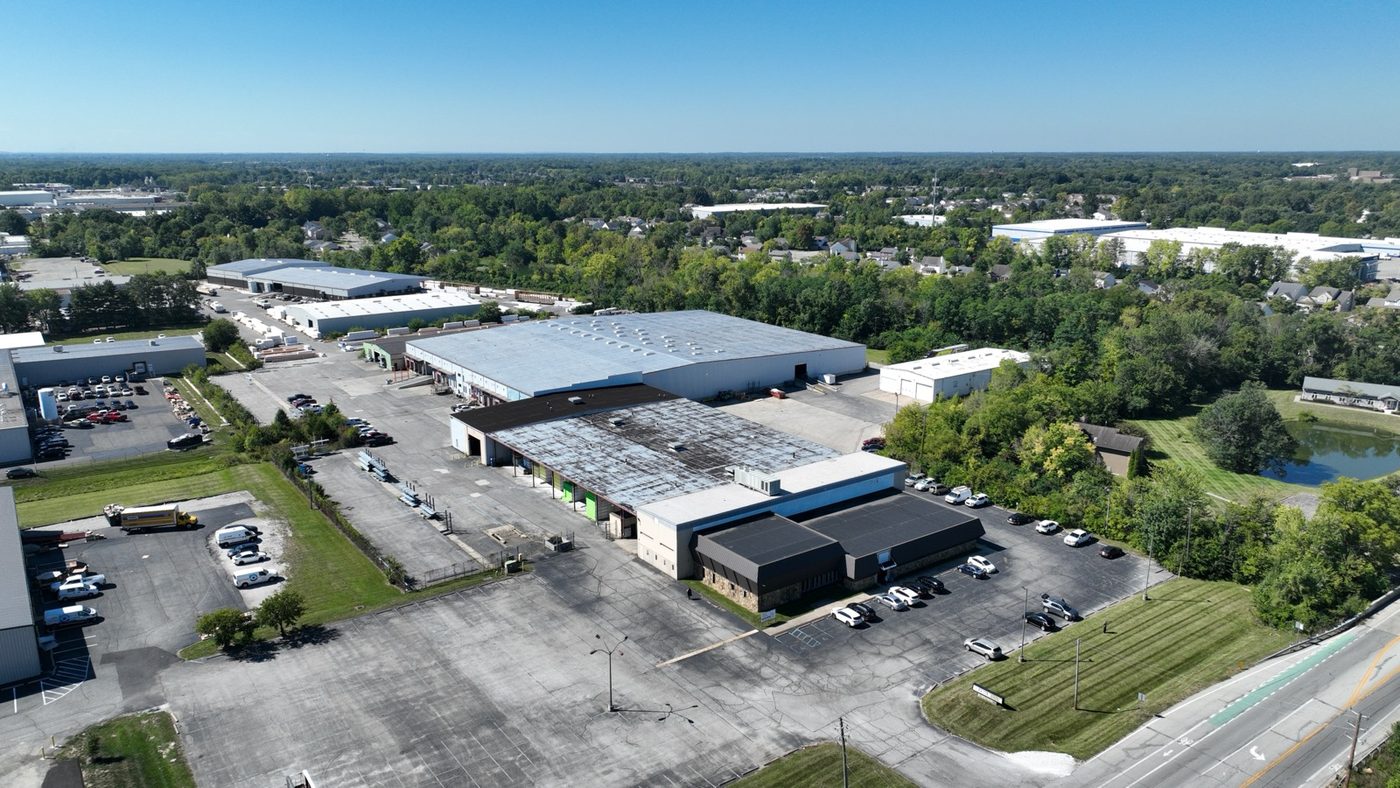
We target functional small-bay, flex, and single-tenant net-lease industrial below the institutional radar, in supply-tight Midwest submarkets, bought below replacement cost with a conservative capital stack. We underwrite to a margin of safety, not a best case. Targeted outcomes are targets, not guarantees, and industrial carries real risks — tenant credit, rollover, interest rates, and liquidity among them. No real estate is risk-free.
For the longer version of the thesis and how passive deals in this segment are structured, see our passive-investing hub and our Midwest industrial market guide.
The takeaway
Midwest industrial isn’t a momentum trade. It’s a patient one: steady demand from reshoring and logistics, against a supply base that’s hard to grow, priced wider than the coasts, and bought below what it costs to replace it. Low basis. Tight supply. Rents with room to run. For accredited investors who want hands-off industrial exposure without paying gateway prices, this is a corner of the market worth understanding now, while the gap is still there.
Bluebird works with accredited investors evaluating Midwest industrial — request access.
This article is educational and is not investment, legal, or tax advice, nor an offer to sell securities.

Cody Leivas · Principal & Managing Partner, Bluebird CRE
Principal & Managing Partner at Bluebird CRE, where he underwrites and operates value-add Midwest industrial real estate. He holds a Master of Science in Real Estate (Chapman) and a Master of Investment Management & Financial Analysis (Creighton), with involvement in $750M+ of commercial transactions. More from Cody
Start a conversation to learn how we acquire Midwest industrial. Start a conversation