Indianapolis Industrial Real Estate: Market Report
July 21, 2026 · By Cody Leivas · Indianapolis market
A 7.6% headline vacancy rate makes Indianapolis look soft. We read it the other way. Here’s the reason: the big-box towers that pushed that number up are a different market from the functional small-bay we own. That segment is still tight, still below replacement cost, and still where the steady demand lives at the I-70/I-65 crossroads.
The numbers
Indianapolis carries roughly 432 million square feet of industrial inventory across about 7,075 buildings (CoStar, Q1 2026). Vacancy sits near 7.6%, with availability around 7.5% — higher than the tighter Midwest markets we track. Average asking rents are about $7.71 per square foot, with triple-net rents near $7.05 (CoStar, Q1 2026).
Rent growth has gone flat: roughly 0.2% over the trailing 12 months (CoStar, Q1 2026). That stall isn’t a demand problem. Net absorption ran about 11.5 million square feet over the same period, against 3.5 million square feet of net deliveries — tenants are taking space faster than it gets built. The drag is the 6.5 million square feet still under construction, almost all of it big speculative box that competes on price until it leases.
The market clears at a higher cap rate than the coastal gateways: roughly 8.6% market cap rate, with industrial trading near $79 per square foot (CoStar, Q1 2026). If you’re underwriting to in-place cash flow, that entry yield is the point.
Why the basis matters
The one fact that organizes our view of Indianapolis: you can still buy functional infill below the cost to build it. When sale prices sit near $79 per square foot and replacement cost runs well above that, the gap does the work over time. Here’s how it plays out: existing rents pull toward the cost of new supply, and the downside is cushioned because no developer adds competing space at a loss.
That’s a below-replacement-basis thesis, not a momentum bet. We’re not underwriting to a big exit or to cap rates falling. We’re underwriting to a basis that makes sense even if rent growth stays flat. And Indianapolis, with its flat trailing rents, is exactly the kind of market where patient buyers get paid while merchant developers pull back.
Sale prices near $79/SF sit well below replacement cost — and 11.5M SF of net absorption against 3.5M SF of deliveries over the past year tells you the demand is real. The vacancy overhang is a big-box problem. The functional small-bay segment trades in a tighter market that the headline number hides.
The bifurcation
Indianapolis is two markets wearing one vacancy number.
- Big-box (200,000+ SF): Speculative supply along the major logistics corridors overshot demand. That’s what drove vacancy up and rent growth to zero. It’s also not what we buy.
- Small-bay and flex (15,000–80,000 SF): The buildings local manufacturers, distributors, and trades actually occupy. New construction rarely pencils at this size, so the segment stays short of product and far tighter than the headline.
The mispricing comes from investors reading one number for two different assets. We focus on the segment the speculative wave never touched.
Submarkets we watch
- Plainfield / AmeriPlex — the established southwest logistics core near the airport, with deep tenancy and strong interstate access.
- Whitestown / Lebanon — the fast-growing northwest corridor along I-65, where most of the new big-box has landed.
- Southeast / I-74 — functional, affordable product serving regional distribution.
- Park 100 — a mature, infill northwest node where smaller-bay buildings stay leased and trade well.
Demand drivers
Indianapolis sits within a one-day drive of roughly 80% of the U.S. population, where six interstates meet — the logistics case writes itself. The tenant base is deeper than logistics alone: FedEx Express runs its second-largest global hub at Indianapolis International Airport, and the metro anchors advanced manufacturing through Rolls-Royce, distribution through Amazon, and older industrial through names like Cooper Tire.
Industrial employment of roughly 168,000 across a metro of about 2.2 million people supports a broad, sticky base of occupiers (CoStar, Q1 2026). Here’s why that matters: when your demand comes from air cargo, aerospace, e-commerce, and traditional manufacturing all at once, the small-bay demand holds up instead of swinging with one cycle.
How Bluebird approaches the market
We underwrite Indianapolis on in-place versus market rent, lease structure and rollover, submarket-level vacancy instead of the metro headline, and a conservative capital stack. Value comes from leasing, mark-to-market on renewal, and steady operations — not financial engineering. Our edge here is operational.
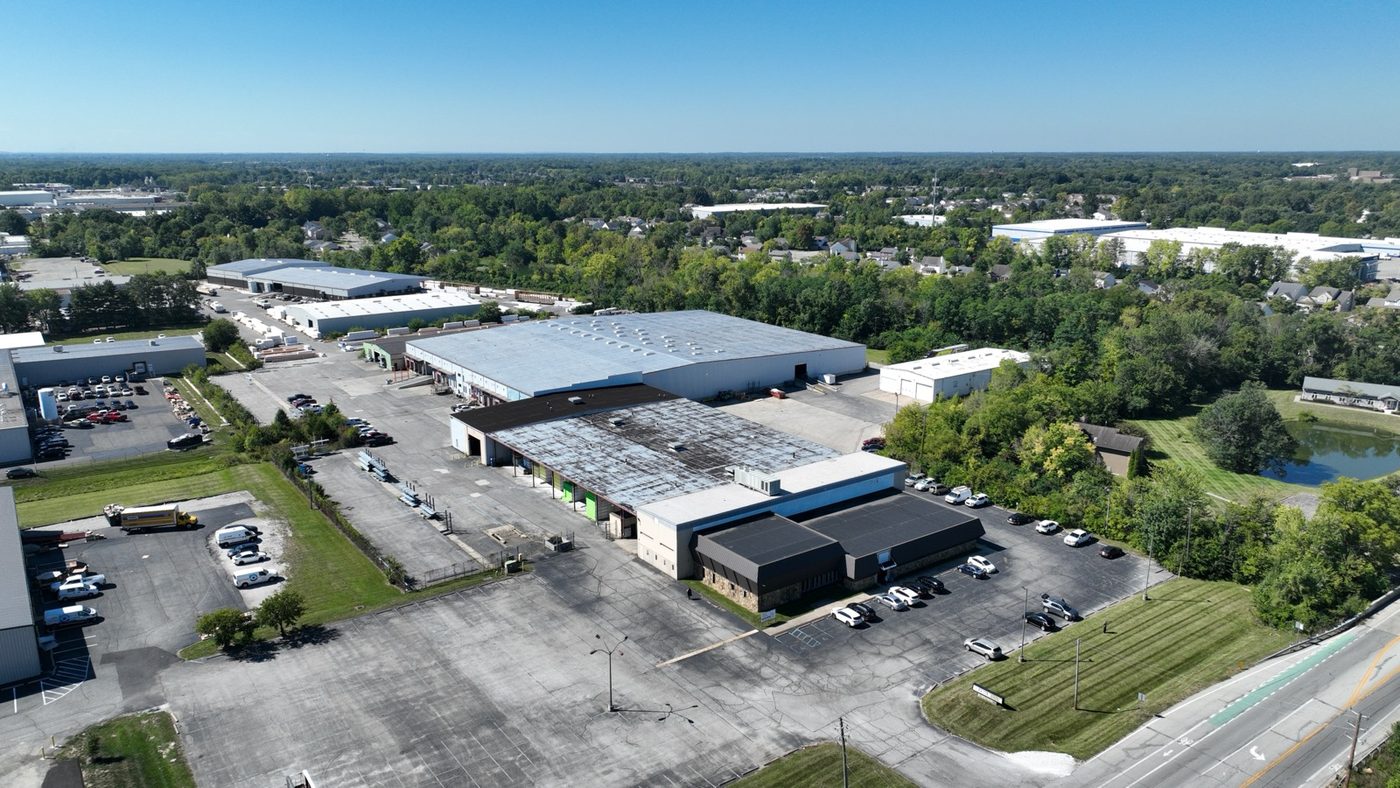
We own in this market, including a building on West 71st Street. For the broader thesis, see our Indianapolis market page, the full Midwest industrial market guide, and our other market reports.
The opportunity in Indianapolis isn’t the big-box headline — it’s the quiet, supply-short small-bay underneath it, bought below replacement cost and run well. Low basis. Tight supply. Demand that doesn’t quit. Pretty simple play. Bluebird works with accredited investors — request access to learn more.
Market statistics above are drawn from third-party sources believed reliable and are provided for informational purposes only. They are not a guarantee of future results, and any targeted outcomes are subject to risk, including loss of capital.

Cody Leivas · Principal & Managing Partner, Bluebird CRE
Principal & Managing Partner at Bluebird CRE, where he underwrites and operates value-add Midwest industrial real estate. He holds a Master of Science in Real Estate (Chapman) and a Master of Investment Management & Financial Analysis (Creighton), with involvement in $750M+ of commercial transactions. More from Cody
Start a conversation to learn how we acquire Midwest industrial. Start a conversation